
Colour analysis, from the Bauhaus to ΔE: what “your season” gets right, and what a camera gets righter
Seasonal colour typing is a century old and mostly a good idea. The part it never had was a measurement.
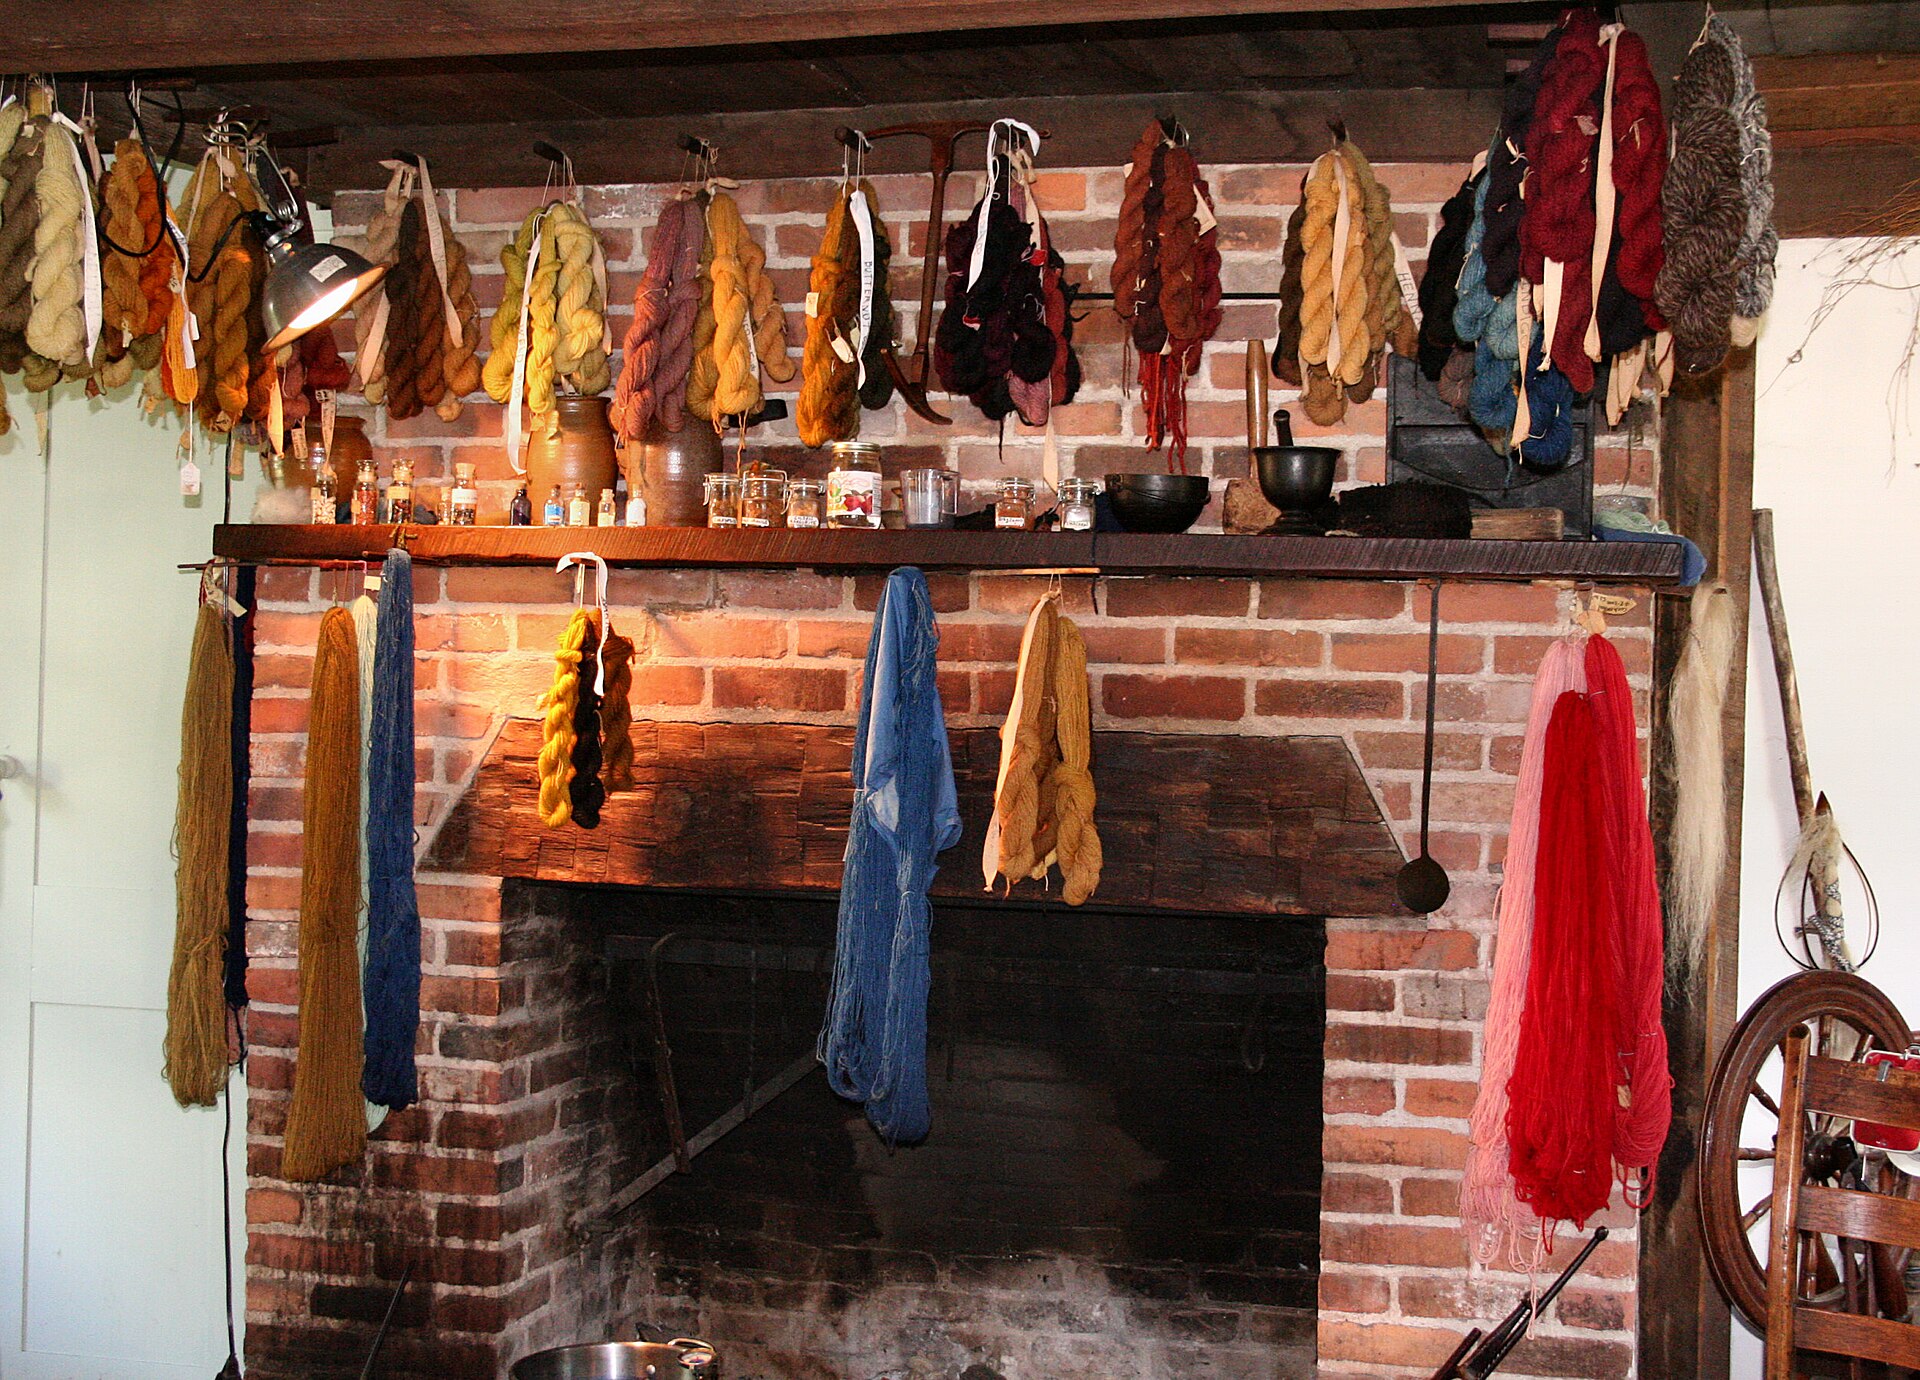
The idea that some colours suit you and others do not is much older than any app, and its lineage runs through one of the twentieth century’s great art schools. Johannes Itten taught the foundation course at the Bauhaus in the early 1920s and built his colour teaching around two properties that still do most of the work: temperature — whether a colour leans warm or cool — and value, whether it is light or dark. He also noticed something that his students’ exercises kept demonstrating: the palettes people were drawn to tended to harmonise with their own colouring. He did not invent a system for sorting people; that came later, and the popular histories that credit him with it overstate the case. What he supplied was the axes.
The sorting arrived in America. Suzanne Caygill founded a commercial colour-analysis practice in San Francisco in the 1940s and refined a seasonal model over decades of clients. Her student Carole Jackson turned it into a household phrase with Color Me Beautiful in 1980, which sold more than a million copies and put the four seasons — Spring, Summer, Autumn, Winter — into every department store and most mothers’ vocabularies. The method is simple enough to remember: read the undertone of skin, hair and eyes as warm or cool and as light or deep, place the person in a season, and hand them a palette of colours that share those qualities.
As a heuristic it is genuinely useful, and it is worth saying so before criticising it. It explains why a warm-undertoned face looks tired against icy blue and alive against rust, why some people can wear pure white and others only cream, why a black that is “right” on one person is draining on another. It gives people a vocabulary for something they already sense. The problem was never the theory. The problem is that its input was always a person holding fabric drapes under whatever light the room had, and squinting.
Colour science solved the squinting problem decades ago, in a different building. The CIE’s 1976 L*a*b* space — CIELAB — describes any colour as three numbers: L* for lightness, a* along a green-to-red axis, and b* along blue-to-yellow. The space is built so that equal distances in it are roughly equal to the human eye, which is the property that makes it useful. The distance between two colours in that space is called ΔE, and the field’s working figure for a just-noticeable difference is about 2.3. Below that, two colours are the same colour to a human being. Above it, they are not — however similar the words on the labels.
That single number changes what a wardrobe can know about itself. If every garment carries a measured L*a*b* value instead of a word like “navy”, the wardrobe can answer “which of these two blues is actually closer to my coat” with a distance. It can find the near-duplicates — the three black tops sitting within a ΔE of two of each other — that a human eye and a crowded drawer conspire to hide, and it can say so before a fourth is bought. It can hold a personal palette as a region in colour space rather than a printed card, and score a candidate purchase against it. And it can do the seasonal analysis itself, from the same measured undertone the consultant was estimating by eye, and be consistent about it on a cloudy Tuesday.
A worked example makes the distance concrete. Two navy blazers, from two brands, both labelled navy. Measured, one sits at roughly L* 22, a* 3, b* −18 and the other at L* 25, a* 1, b* −24: a ΔE of about seven. To the eye, side by side in daylight, they are visibly different blues — one inkier, one closer to royal — and they will not pass as a suit. Apart, on different days, nobody would ever know. That is the whole argument for measurement in one pair of jackets: the label said they matched, the eye could not have told you without holding them together, and the number knew.
The same arithmetic runs the other way for a personal palette. A warm-undertoned skin sits on the positive side of the b* axis; the colours that flatter it sit there too, and the icy blues that drain it sit far on the negative side. A season, in this reading, is a region of the colour space, and a garment either falls inside that region or does not, by a measurable margin. A consultant with drapes is estimating that margin. A corrected photograph is measuring it, and can do so for every garment in the wardrobe in an afternoon rather than for the twelve drapes in the bag.
This is the approach ZIMRICS takes. Colour is measured from the photograph, corrected for the light it was taken in, and stored as data on the garment. The seasonal vocabulary stays, because it is how people talk about colour and because it is, at its core, correct. The measurement sits underneath the vocabulary, because it is how colour actually works.
The honest caveat belongs here, and it is the one every colour scientist would raise first. A phone camera is not a spectrophotometer, and white balance is the enemy of every measurement it makes. A garment photographed under a warm bedroom bulb and the same garment photographed by a north-facing window will disagree by far more than 2.3 ΔE, and both readings will be wrong in different directions. The fix is the same one a laboratory uses: put a known reference in the frame — a neutral card, a calibrated target — and correct the whole image against it. It is a small discipline that turns a snapshot into a reading. Without it, measured colour is just a more confident version of squinting.
What I find quietly satisfying about this is how little the theory had to change. Itten’s two axes are still the two axes; Jackson’s seasons still describe real harmonies. All that has happened is that the input moved from a person’s eye to a number that two people can agree on. Colour analysis did not need replacing. It needed a ruler.